A KPMG framework

As readers of this blog will know, I am always interested in other frameworks (other than the Operating Model Canvas) because it is often possible to learn something or to see the same issues from a new perspective.

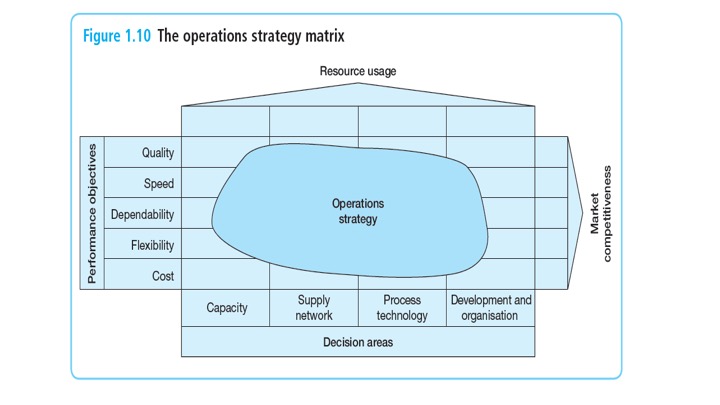
So here is a KPMG framework that I extracted from a document on LNG operating models (liquid natural gas).  Unfortunately the resolution of the exhibit is poor, so I will explain.  In the coloured column the top dark blue box says “Financial ambition” and the bottom dark blue box says “Measures and incentives”.  The three slightly lighter shades of blue are bracketed as “Business Model” – Propositions, Markets, Customers and channels.  The four

even lighter blue boxes are bracketed as “Operating model” – Core business processes; Operational and technology infrastructure; Organizational structure, governance and risk controls; People and culture.  The other two columns are “Key questions” and “Accelerators”.

So what?   First there is nothing in this categorization of business model and operating model that is different from Operating Model Canvas.  But a couple of points are worth noting.  First, the term business model is used to refer only to the front end of the Business Model Canvas.  In other frameworks, such as PA Consulting’s framework, this is referred to as “customer model” or “value proposition model”.  Business model includes customer model and operating model. So readers should be aware of the different ways different consultants use the term business model.

Second, in the operating model categories there is one for “Operational and technology infrastructure”.  This combines digital and mechanical machines and applications, which seems odd for LNG companies who have drilling rigs and IT systems. It also makes me think that the Operating Model Canvas lacks a good place for thinking about things like drilling rigs.  When they come up, I typically think of them as part of the “core processes” and also think about them again when considering locations.  But this framework gives them a bit more status.

Third, the KPMG framework has a box for “Organisational structure, governance and risk controls” and a separate box for “Measures and incentives”.  This seems a very odd split.  The question in the next column against measures and incentives is “Do you have the right metrics to incentivize the organization for end-to-end business optimization?” which is a pretty odd question, but makes me feel that this should be part of the organization box.

In the Operating Model Canvas the split is between the design of the organization – structure, people, incentive systems, culture, decision rights, etc – and the management system needed to run the organization – planning, budgeting, targeting, performance management, risk management and continuous improvement – and the scorecard that tells leaders whether they are on track. I think this is a cleaner split.

The word governance, however, has always given me difficulties in this context.  For a project, governance refers to the steering group and the design authority that the project needs to work with.  For an organization it is partly the decision rights and committees, which I think of as part of organization design, but it is also the planning, budgeting and risk processes that I position as part of the management system. So the word governance cuts across different categories in the Operating Model Canvas. As a result, I have started avoiding the word where possible, yet its usage is growing and may be confusing people rather than enlightening them.

Last point, I was intrigued by the other two columns – Key questions and Accelerators.  What is attempted here is to list the key questions for an LNG company in the current market and also the levers that managers might use to accelerate future performance.   I like the idea very much – but I did not feel that this list of questions and accelerators quite delivered.  Either it is too long so not honing in on the real insights or it is not based on good insights.  Questions like the “Are you able to respond to changing demands?” or “How are you monitoring risk and evaluating new risks?” left me flat.  I was equally unmoved by the text in the Accelerators column “5. Unit cost competitiveness.  Challenge complacency and bring insights from downstream business with a relentless focus on asset performance through lower capex and opex as well as maximum possible throughput.”

But I am determined to have a go at this format for a business I know well to see if it can be made to deliver something more dramatically insightful, as I tried to do on pages 144 and 145 of Operating Model Canvas.

Advertisement
Posted in Business model, OM frameworks | Tagged , , , , , , | 1 Comment

Operations Strategy Matrix and Operating Model Canvas

Last week I spoke at an interesting conference hosted by Loughborough.  It was to discuss their approach to operating model work – SOMS – standing for Service Operating Model Skills.  Also speaking were two consultants from OEE, who have partnered Loughborough on the SOMS framework: Martin and Vishnu.  This blog is about one slide that they showed which got me thinking.

The slide was a version of this matrix from the Slack and Lewis text book “Operations Strategy” third edition 2011, Prentice Hall.  The left side of this matrix is “Performance objectives” which leads to “market competitiveness” on the right side.   The bottom axis is operational “Decision areas” leading to “Resource usage” at the top of the matrix.   The boxes in the matrix are used to layout the main elements of the operations strategy or operating model.

This matrix is familiar.  But, for some reason, the way it was presented by Martin and Vishnu, using a case study of a bank, got me thinking in two ways.  First, if instead of “Performance objectives” we use “Value proposition”, the matrix would have the same focus as the Operating Model Canvas.  I will come back to this.   Second, if instead of “capacity”, “supply network”, “process technology” and “development and organization”, we use POLISM – processes, organization, location, information, suppliers and management system – the matrix then has the same decision areas as the Operating Model Canvas.

So the big thought going through my head: is the Operating Model Canvas, just a reinvention of the Slack/Lewis operations strategy matrix?  The answer seems to be yes.  So the next question: is the Operating Model Canvas superior and if so why?

I have little doubt that the POLISM categorization of operations decisions is superior: more strategic, more complete and more managerially friendly.  It does not include capacity, in terms of numbers of people or size of machines.  But, for me, the sizing issue is a second order issue.  First you define the operations strategy. Then, given the strategy and the plans for the next period, you decide how much capacity to build for the next period? (I should point out that under the broad heading of capacity Slack and Lewis, include location and buildings, so it is close to the L in POLISM)

Where the Slack/Lewis approach may be superior is in the way it lays out “performance objectives”.  The Operating Model Canvas has “value proposition”.  But does not sub-divide the concept of value proposition in any structured way.  So I have spent a couple of days trying different ways of laying out a value proposition using a similar format.  See a couple of attempts below.  The first is for my course Designing Operating Models (see www.ashridge.org.uk/dom).  The second is about Test Equipment

My conclusion is that one row should be devoted to describing the product/service: is it a piece of test equipment or a management course?  The rest of the rows should describe the main features of the value proposition, particularly those that are expected to give advantage (the USP) (coloured in reddish orange).  If POLISM is put along the top axis, the bottom axis can then be used to summarize the aspects of the “operations strategy” that are most important to each of the elements of POLISM: the words that you might expect to find on an Operating Model Canvas.   If you have used the Operating Model Canvas tool, you will know that you should describe on the Canvas, (in addition to the value chains and the org chart) those aspects of operations that are most important to delivering the value propositions: exactly the same thought as the descriptions in the Slack/Lewis matrix.

So the Slack/Lewis format allows a more fined grained presentation of the value proposition, and hence a more fine grained connection between the value proposition and  POLISM.  Worth thinking about.  I will include it in my next course on Designing Operating Models and see how the participants like it.

Of course the Slack/Lewis format has other weaknesses.  It does not lay out the value chain. Hence my lettering in the top left box of the examples (my attempt to lay out a value chain in a very small space!)   As a result, the Slack/Lewis format does not visually show that the OLISM parts of POLISM exist to help make the P of POLISM (the bit that creates the value proposition) work.

But, as I keep repeating in this blog series, it is always worth understanding other people’s frameworks because most will have a dimension that is better than your own model.

Posted in OM frameworks, Operating Model Canvas, Value proposition | Tagged , , , | 14 Comments

The forces that are driving operating model change

At various stages in the last few years I have had a check list of trends (mainly tech trends) that managers should be considering when they are reviewing processes or operating models.  Things like “automation” or “digitization” or “mobility” or “social media”.  The basic idea is to encourage managers to think about whether they are exploiting these new technologies enough in their new process or operating model designs.

So I am always on the look out for an article that synthesizes down all these different trends into a manageable number to think about.  In 2017, two articles got particular attention from me, one from BCG and one from McKinsey.

The BCG report “Twelve forces that will radically change the future of work” by Vikram Bhalla, Susanne Dyrchs and Rainer Strack has five trends that interest me (the other seven are about changes in the customer desires or the workforce).  The five are:

– automation: nearly half of all jobs in the US can be automated

– big data and advanced analytics: 2.5 quintillian of data are generated every day

– access to information and ideas: 7.6 billion people will be using mobile devices

– simplicity in complexity: 74% of managers believe that complexity is hurting performance

– agility and inn0vation: 90% of managers say that agility is needed to execute strategy

The McKinsey article “The next generation operating model for the digital world” by Albert Bollard, Elixabete Larrea, Alex Singla and Rohit Sood only has five trends.  The five are:

– Lean process design: streamline processes and eliminate waste

– Digitization: digitize both customer experience and day-to-day operations

– Business process outsourcing: drive the next generation of outsources and offshoring

– Advance analytics: provide intelligence to facilitate decisions

– Intelligent process automation: to replace human tasks

What should we take away from these two authoritative sources?  First, neither includes the big fad of the last five months Artificial Intelligence (although it underpins two or three of the McKinsey list and two of the BCG list).  Second, there are some notable similarities and differences.   Both include automation and analytics.   BCG has access to information, agility and simplicity.  McKinsey has lean, digitization and outsourcing.

So here is my list –  ALODSAMOSA

  • Automate (including artificial intelligence)
  • Lean
  • Outsource
  • Digitize (both the customer interface and operations)
  • Socialize (take advantage of social media)
  • Analyze (collect big data with sensors and analyze)
  • Mobilize (enable people to work anywhere)
  • Offshore
  • Simplify (cut complexity)
  • Agilify (reduce the time it takes to change)

The question to ask of any process or any operating model is “Are we exploiting the trends of ALODSAMOSA?”  It is a bit of a mouthful, but quite catchy once you have said it a couple of times.

What additional or different items would you suggest?  What about printed manufacturing? What about “environmentalize”?  What about dignity at work?  And then there are age old concepts such as “specialize” or “empower” or “align”.


Posted in Design tools | Tagged , , , , | 2 Comments

The impact operating model work has on strategy

I am working with a client at the moment on an “operational review”.  I am still at the “explain the methodology” stage:  one of my roles is to skill up the project team so that they can use the Operating Model Canvas and associated toolbox.

The session today demonstrated the power of operating model work in helping challenge and crisp up strategy.  The organisation has a mission statement, three strategic priorities, corporate values and so on.  But the work we were doing today on a stakeholder map and a value chain map demonstrated some weak or unclear thinking in the strategy.

When we laid out the stakeholder map we had a hard time distinguishing between those stakeholders that are “customers” or “beneficiaries” from those that are “business partners” or “suppliers”.   The organisation is a charity.  Some of the confusion was about the funders and don0rs.  Were these funders suppliers or customers?  This depended on whether the charity decided what work to do and then looked for funders to support the work (making funders into suppliers/business partners) or whether the charity was offering its services to funders and it was the funders who decided what work should be done.  Frustratingly the strategy did not make this clear: the charity seemed to be doing both but the words in the strategy suggested that the charity was focusing on the first.

Another confusion was about the logic for the charity work.  When we picked a specific beneficiary and asked why the charity was doing work for this beneficiary, we were not sure whether it was to help the beneficiary as the end objective or to achieve some larger goal through helping the beneficiary. Again, the strategy documents and mission statement did not help us resolve this.

Some similar confusions occurred as we worked on the value chain map. We tried listing the different types of customer/beneficiary that the organization seeks to help; so that we could articlate value propositions (services) and draw out value chains (processes) for each beneficiary.  But this depended on answers to the previous questions.  Was the organization trying to help funders spend their money or was the organization trying to help a particular beneficiary? Also, was the primary beneficiary the person receiving the service or the people who benefited at one level removed? Think for example of helping a disabled child in order to ease the burden on a family.  Was the objective “ease the burden on families” or “help a disabled child”.

In a future blog, I hope to be able to illuminate this example with more specifics.  But, at the moment, the work is confidential and hence this material is well disguised.   The core point I am making, though, is that tools like the stakeholder map and the value chain map, force strategists to make choices, construct hierarchies of objectives and clarify mission in a way that is often missing from the tools used in strategic planning. This is because it is hard to design the operations without making these choices.  As a result, working on the operating model can lead to clearer and better quality strategies.   Maybe all strategic plans should include, at the back end, an Operating Model Canvas, as a forcing device to encourage crispness and clarity.

One conclusion we were able to make today: the first step in the project will need to be focused on clarifying the strategy.  Once this is done, we can then consider whether the current operating model will need to change.

Posted in Strategy | Tagged , , , , , | Leave a comment

Operating models and agile

I recently gave a talk at the European Organization Design Forum on the topic of agile organizations.  This forced me to think deeply about what agile is and how it relates to organization design.  So let me share some of these thoughts here and expand the topic to include operating model design.

First a definition of agile: “being able to turn on a dime for a dime” and “being able to change faster and more cheaply than your competitors”.   These phrases are taken from Craig Larman, who was part of the team who coined the term agile as being relevant to the lean and six sigma community.  In this community, agile is associated with short-period (often six-week), test-and-learn projects, at the end of which priorities and direction can be reset based on what has been learned.  It is also associated with “minimum viable product”: the way of testing a new idea.

So what has it got to do with operating models or organization?  First, when making change, an agile approach to the change is probably wise. Don’t try to plan it all out and then execute. Instead, make some change quickly and then reassess.  Of course, in many tall hierarchies, the quick-cycle, test-and-learn approach is hard to make happen because, to get approval for change, top layers in the structure often want a fully-worked and costed business case.  Changing the plan and the business case every few weeks is hard both administratively and politically.  So one of the implications of agile is that we need to have decision processes in organizations that focus more on “intent” rather than “plan”, and decentralize achievement of intent down to teams that can operate in an agile way.

Second, there are lots of components of organization and operating models that are not, and never will be, agile.  In fact your ability to succeed in period A is often a function of your willingness to make commitments now that may cause you to be inflexible in period B.   Think for example of a company competing for a contract with Tesco or Walmart.  To win the contract, the company often has to demonstrate that it has built the capacity and developed the systems needed to serve this customer.  This capacity and technology can then become legacy problems if the customer changes its needs.  Yes you can build flexible capacity and systems, but typically these are more expensive than dedicated solutions: so there is a trade off.

The choice of the head of the organization is another example of a decision that is typically anti-agile.  Every leader has strengths and weaknesses.  If circumstances change so that the weaknesses become a significant disadvantage, it typically takes a year or two before the head can be changed.

If we think through the components of an operating model – POLISM – we can see the tensions that agile raises.   A process needs to be “leaned” to deliver a particular value proposition.  But this will make the process costly or less effective for delivering slightly different value propositions: the process becomes anti-agile.

Organization structure, even if controlled by holacracy (the self organizing method), takes time to change: it becomes anti-agile.

Location is expensive to change not just because of leases and the moving of people and equipment, but also because of other elements of the operating model that are influenced by location – supplier relationships, customer relationship, attractiveness for employees, etc.  So location can be anti-agile.

Legacy information systems are frequently a cause of lack of agility.  But, there is often no way round the problem, especially with bespoke software.

Supplier relationships can be anti-agile: effective relationships often take years to build.

Finally, management processes and scorecards can be anti-agile.  An organization that has been driven for ten years on a metric of sales margins, will take some years to convert to a return on capital metric or a sales volume metric.

So, when we design organizations or operating models we are often deliberately designing in aspects that will be anti-agile. Nevertheless, there is still benefit to the agile thought.  We need to think quite hard every time we make a design choice that is anti-agile, whether we are doing the right thing.  The simple question to ask is “once the new design is up and running, if circumstances change, how long will it take to change to another design both from a political and executional perspective.?”  For those of you who have used the tool “The nine tests of good organization design”, you will recognize the ninth test – “the flexibility test”.

Posted in Agile and operating models | Tagged , , , , , , | 8 Comments

Linking transformation projects to strategic intent

I spent a fascinating morning yesterday with the head of transformation design in a UK government department.  Like most government departments, the transformation is about cutting costs while improving outcomes.  The lever for achieving this is technology – in particular, digital technology.

The transformation program has been funded and has been underway for a year or more.  The problem we were discussing had two parts to it.  First, how can the leaders be sure that the transformation projects that are underway will deliver the strategic intent (cut costs and improve outcomes)?  Second, since some projects are over spending, how can the leaders decide which projects to cut out or cut back?

Step one in dealing with these questions, of course, is to get really crisp about the strategic intent.  I thought that the department had done a good job – here I am simplifying a little to maintain confidentiality – but there appeared to be good clarity about the objectives of cutting costs and improving outcomes.  The department had also done a segmentation of types of citizens that it was interacting with, and it had sub-divided the overall transformation program into sub-programs and then into projects.  So what was the issue?   The sub-programs were not aligned either with the strategic intent (e.g. sub-programs for cutting costs and sub-programs for improving outcomes) nor with the types of citizens (e.g. sub-programs for citizen group X aimed at both cutting costs and improving outcomes and sub-programs for citizen group Y, etc).  Also, the sub-programs and projects had not been prioritized in terms of their expected impact on the strategic intent.

The head of transformation design asked for advice on whether a different transformational methodology would give more accurate strategic alignment. One approach that had be suggested to him was to use “capabilities” as the connecting tissue between strategic intent and projects.  By listing the capabilities needed to deliver the strategic intents (level 0), then listing the capability components for each capability (level 1) and then the requirements for each capability component (level 2), etc, it should be possible to connect projects to intent.  I felt uncomfortable with this approach, because I could not see an easy way of breaking “cut costs” or “improve outcomes” down into a MECE (mutually exclusive and collectively exhaustive) list of capabilities … and, even if this were possible, developing MECE lists at level 1 and level 2  would be difficult … and, even if this were possible, connecting level 2 lists to projects would probably also be difficult.

So I suggested another way of linking strategic intent to projects: chunk up the department into smaller pieces each of which should be trying to “cut costs” and “improve outcomes”.   Here the value chain map tool is powerful.   So my suggestion was to start with the citizen segmentation (again I have simplified a little to protect confidentiality) and to develop value chains for each segment and for each product or service provided to each segment.   Then lay out a simple value chain for each of these segment/service combinations (probably around 100 in total).  Then apply the intent – “cut costs” and “improve outcomes” – to each of these 100 value chains.

This will provide a MECE list of the changes needed.  This list of needed changes could then be set against the list of transformation projects to see if the projects cover all the needed changes.  If not, the intent will not be delivered.

By rank ordering the 100 segment/service combinations based on their strategic importance, and then ranking the needed changes by likely impact on “cutting costs” or “improving outcomes”, it would be possible to rank order the projects by their likely impact on the strategic intent.  This will then make it possible to decide which projects to drop or cut back.

The conversation reinforced a concern I have with the capability mapping approach to operating model design (see previous blogs).  The head of transformation design also explained that the differing languages of design and Portfollio management sometimes clashed. Whereas my experience is that leaders readily connect with the value chain language and visual representations used to support it.

Of course, in some ways, it is just a different use of words.  What I call a value chain could also be called a capability chain or a process chain.  But, in other ways, there is a huge difference.  The value chain mapping approach encourages you to chunk the organization up into “segments” each of which is aiming to deliver value to a target customer or beneficiary.  So your focus is on what the organization is trying to do for its stakeholders and to a presumption of decentralized units each targeted at a different segment.  The capability mapping approach encourages you to chunk the organization up into capabilities.  The focus switches to being more internal, and to a presumption of centralized functions in charge of these capabilities.  These are very different ways of thinking about organizations.  The former is more likely to help you connect with strategic intent.

Posted in Capabilities, Transformation | Tagged , , , , | 25 Comments

Supplier matrix

One of the core tools in operating model work is a supplier matrix.   The matrix helps clarify why some activities are done in house and others are subcontracted or bought in.  It also identifies those suppliers with whom the organization needs to have a carefully designed collaboration.  The “collaboration tests” are then a tool for checking that the “carefully designed collaboration” has been well designed!  This blog will briefly describe both tools.

Supplier Matrix

The supplier matrix has two axes – yes it is a matrix!   The horizontal axis asks the question “Is this a key activity in delivering value?” and is scored in a binary fashion – yes or no.  But the axis can also be used as a scale, with a “maybe” position somewhere the middle.  The vertical axis asks the question “How good are we relative to others?”  Again, it is scored in a binary fashion – better or worse.  But, like the horizontal axis, there can be a middle position of “about the same”.

This two by two matrix has four boxes.  Bottom left is where the activity is not a source of advantage or excellence and where we are relatively bad at it (costs too high or skills too low).  For these activities, the answer is to outsource with a simple contract.

Top left is where the activity is not a source of advantage and where we are relatively good at it.   For these activities, we can do it ourselves if it does not distract us from more important activities.  If it is a distraction, for example because we are short of skills or money, then we should outsource the activity with a simple contract.

Top right is where the activity is a source of advantage and we are relatively good at it.  These are activities that we should give priority to: they are the core of our reason for existence.

Bottom right is where the activity is a source of advantage, but we are not very good at it.  This is a dangerous position on the matrix.  If we do it ourselves, we are likely to do it badly, and, because it is really important, we may be hurting ourselves or our customers.   If we outsources this activity, we are placing ourselves in the hands of a third party who may take advantage of us (demanding high prices) or let us down.  We are between a rock and a hard place.

The solution to this box on the matrix is to design a collaborative agreement which will motivate the supplier to want to do the best for us and which will still leave us with enough bargaining power to resist exploitation.   As you can imagine these are difficult agreements to design.  Often they involve joint ventures or special purpose vehicles or pain and gain sharing agreements.

Rather than continue this blog on the topic of collaboration tests (tests that help you design good agreements with important suppliers),  I will deal with this in the next blog.

Posted in Supplier Matrix | Tagged , , | Leave a comment

Process evaluation grid

In response to my recent post on the Process Owner Grid,  Richard Rawling responded that he frequently uses a tool called Process Evaluation Grid.    This tool also has the process laid out along the top of the grid – same as my adjusted Process Owner Grid.  The difference is that down the side of the grid are listed performance evaluation criteria, such as customer satisfaction and cost – see example from Nous Group.

This tool reinforces my earlier blog about the value of positioning the process steps along the top of the grid.  It also fits with a strategy tool that I often use which I call “value chain analysis”.  This involves laying out the value chain and then asking under each step in the chain two questions

  1.  Is the cost of this step, as a percent of sales, higher or lower than that of competitors and why?
  2. Is the value that this step creates for the customer, higher or lower than that of competitors and if so why?

To do this well, you need to have an idea of the cost of each step, at least in terms of percent of sales; and you need to know where the customer touch points are and what factors customers most value.

The Nous Group chart has some other questions on it – which can be selected to suit the issue being examined.  It also has the customer touch points and the expectations of the customer at each touch point on the chart, which helps ensure this is front of mind.

My first reaction is that the Process Evaluation Grid is more about strategy analysis than operating model analysis, but I can see the benefit of using it as part of a toolbox for operating model work as well.  It could be used to back up the value chain map.    As you may know, it is often helpful to record “areas of competitive advantage or excellence” and “areas of problem or opportunity to improve” on the value chain map.  This helps ensure that attention is directed at the most important steps in the value chain map.   The Process Evaluation Grid is a tool you might use to help you make these “competitive advantage” and “problem” judgements.

Thanks Richard.


Posted in Process Owner Grid, Value chain | Tagged , , | 1 Comment

Which way round to do the Process Owner Grid

At my most recent course on operating models,  I had an ahah moment about Process Owner Grids.  It is better to lay out the grid with the process steps of the value chain along the top and the organization roles down the side – rather than the other way around.

In my recent blog on Process Owner Grids,  I showed a number of examples with the organization roles along the top and the process steps down the side.  As I understand it, this is the traditional way of doing a Process Owner Grid.  It follows the format of the Decision Grid.  The rationale for this format is that it is typically easier to define an organization role in one word (Finance) or a couple of letters (HR or CEO) than it is to find a short definition of a decision.  Hence, given the space constraints at the top of a column compared to those at the beginning of a row, it is best to describe the decision in a few words on the horizontal (i.e. at the beginning of a row) and define the organizational roles on the vertical (i.e. at the top of a column).  So a decision might be “define the monthly sales target” and those involved might be “Head of Sales”, “Sales Managers”, “CFO” and “CMO”.

The ahah message was that the steps in a value chain are typically laid out horizontally in sequence.  Moreover they are laid out like this in the Operating Model Canvas.  So, when thinking about the value chain the mind is naturally thinking left to right rather than top to bottom.  So it is most natural to put the steps of the value chain at the head of columns in the Process owner grid.  Typically the steps are one word, such as “buy”, “design”, “make”, etc; so they fit comfortably at the top of the columns.   The organization roles must then go down the side of the table.

The ahah moment occurred because we had drawn up a Process Owner Grid for an example in the traditional way.  Then one of the participants, who was only paying partial attention, asked for it to be explained.  To aid the explanation, another participant turned the Grid on its side to show his colleague that the rows down the side of the grid were the same as the steps in the value chain.  This caused everyone involved to question whether it would not be better to redraw the Grid the other way around.

So, from now on, I think I will draw it with the value chain steps along the top.   This has the added benefit of being the same way round as the High-level IT Blueprint.  So the Process Owner Grid and the High Level IT Blueprint are similar charts/grids.

I am ashamed to say that my colleague and co-author Mikel Gutierrez had lobbied to have the Process Owner Grid presented with the value chain along the top in our book Operating Model Canvas – and I resisted because I wanted it to be like the Decision Grid.  But I was wrong!  Much better for it to be like the High-Level IT Blueprint.

Posted in Process Owner Grid | Tagged , , , | 5 Comments

Process Owner Grid

The process owner grid is a powerful way of ensuring that links across the organization structure are not left to chance. It is similar in format to the decision grid (see a blog on this) – hence the similarity in the names. Instead of defining who owns a decision (‘who has the D’) the tool is about defining who is the business owner of a process.   So the following steps are needed to produce a process owner grid.

First, list the important processes that should be examined in the grid.   Start with your value chain map (see other blogs for this). The value chain (or value chains) is the most important process in the organization and should be ‘owned’ by the manager (or managers) responsible for delivering the value proposition at the end of the each value chain; so you do not need a process owner grid to make this decision. You need the process owner grid to record the next level or two of important processes and their owners.

If the value proposition is a manufactured product, the first level – the value chain – could be as simple as ‘buy’, ‘make’, ‘sell’. The second level of important processes would then be the buying process, the manufacturing process and the selling process.   Beyond this level, a third level of process would be the sub-processes of buying, the sub-processes of manufacturing, the sub-processes of selling, as well as processes for the main support functions, like Finance, HR and IT.

When drawing up a process owner grid, always go to the second level of important processes and then decide whether and where it is helpful to go to the third level. Frequently it is helpful to go to the third level, but only in areas where cross-organisational confusion might exit without the extra level of detail.

Once you have chosen which processes to examine with a process owner grid, start by listing these down the side of a grid, in the same way that you would list the important decisions down the side of a decision grid. Since a grid only has room for a few words down the left hand side, it is usually helpful to have a separate descriptor of each of these items explaining more fully what it involves.   So the label might be “buying process” and the descriptor might be something like “Buying process: identify sourcing needs, identify and approve suppliers, get quantities required, contract with suppliers, check quality, warehouse and deliver”.

The next step in developing a process owner grid is to list the organization units along the top axis of the grid. These will be taken straight from the organisation structure chart. Clearly it is impossible to do a process owner grid without clarity about the value chain and clarity about the organization chart. Continuing with the example of a manufactured product, the organisation units might be Finance, Sales & Marketing, Production Product A, Production Product B, Supply Chain, Human Resources (see exhibit).

Now that the grid is formed, the next step is to colour in the boxes showing which organization units are involved in which processes. Choose a different colour for each process. In the exhibit, the “buying process” involves Supply Chain, Production Country A, Production Country B and Finance.   Finance pays the suppliers. The two Production units tell Supply Chain what they need. Supply Chain does the rest of the work.

The final step is to mark on the grid which unit “owns” the process. This means that the unit is responsible for making sure that the process works well. It also means that, when other units want to make changes to their part of the process, they need to discuss their proposals with the “process owner”.

Normally, there is just one unit that owns the whole process. In this way it is usually easier to make sure that the process if fully aligned around delivering the value proposition at low cost. The process owner will often choose to set up a “process governance group” to involve managers from other units. But the process owner will lead this group.

Sometimes the ownership of the process is split between two or more units. In the example of the “buying process”, Supply Chain owns most of the process, but Finance owns the “payments sub-process” and the Production units each own their “forecast supplies needed” part of the process.   Splitting the process ownership is usually only sensible when there is a simple handover at the point where the process is split. The simple handover between Production and Supply Chain is the “production forecast”. The simple handover between Supply Chain and Finance is the “approved invoice”.

The Process Owner Grid is important because it needs to be clear who will responsible for design work at the next level of detail. Each organisation unit will be responsible for the operating models within their own units. But who will be responsible for designing the details of processes that cross multiple units? The Process Owner Grid makes this clear.

The Process Owner Grid is also invaluable to IT. When IT architects are designing the portfolio of software applications and deciding which applications need to be integrated into an enterprise system, they can go to the Process Owner Grid to find out who is involved in each process and who is the “business owner”. They can then be sure to take their guidance from the right people.

Because the Process Owner Grid is so important to IT, the work on who owns which process is often combined with the work on the high-level IT Blueprint. If this happens, the Process Owner Grid is often turned around so that the process steps are listed across the top of the Grid and the organization units listed down the side. This is done to align the process owner grid with the normal format of the IT Blueprint.

Why is the Process Owner Grid normally arranged one way and the high-level IT Blueprint normally arranged a different way? There is no particular logic. The Process Owner Grid evolved out of the Decision Grid. The Decision Grid was arranged with the decisions down the side because it was often important to write a short sentence to explain each decision, and this is easier to do on the horizontal. Also, decision makers can often be identified by a few letters (CEO, CFO, MD, HR, etc), which were easy to put at the head of a column. The IT Blueprint emerged out of process mapping thoughts, so it was natural to put the process along the top running from left to right. The organisation units were then put down the side. Do not feel constrained by these historic influences. If you want to change the axes around, do so. But make sure you communicate what you have done to the audiences you are trying to influence.

It is possible to add additional information on a Process Owner Grid. In the example below, the red arrows identify “difficult links”. These are relationships that are likely to be difficult given the choice of process owner.   Course Admin owns the workbook production process. This can create friction with the Course Director and Faculty members who request special features that Course Admin consider inappropriate. Faculty members each “own” the development of their course materials and can disagreed with Course Admin about how these materials should be presented to the participants.   By exposing these potential frictions the Process Owner Grid can help ensure that they are resolved before they become a problem.

The circles on the Grid identify organisation units that may require some protection from the dominant culture. In this case, the Faculty drive the dominant culture. Hence Media, who control the brand, and Course Admin, who are responsible for efficient administration in line with the brand, may need some protection from the dominant culture.   Normally this protection is given by ensuring that these units have “ownership” of the process that enables them to perform their role in the organisation.

The Process Owner Grid can also be used to mark problem areas and sources of advantage and parts of processes that could be outsourced. These are not shown in the examples. But, hopefully, you can see how valuable this grid is for helping consider important operating model choices.

If you have experience to share or improvements to suggest, please comment below.

Posted in Process Owner Grid | Tagged , , , , | Leave a comment